Home sales and pending sales in Bend were up in August, but there were fewer new listings last month, and the available inventory decreased 5% from July to August. Compared to this time last year, however, there is 81% more available inventory of homes for sale in Bend.
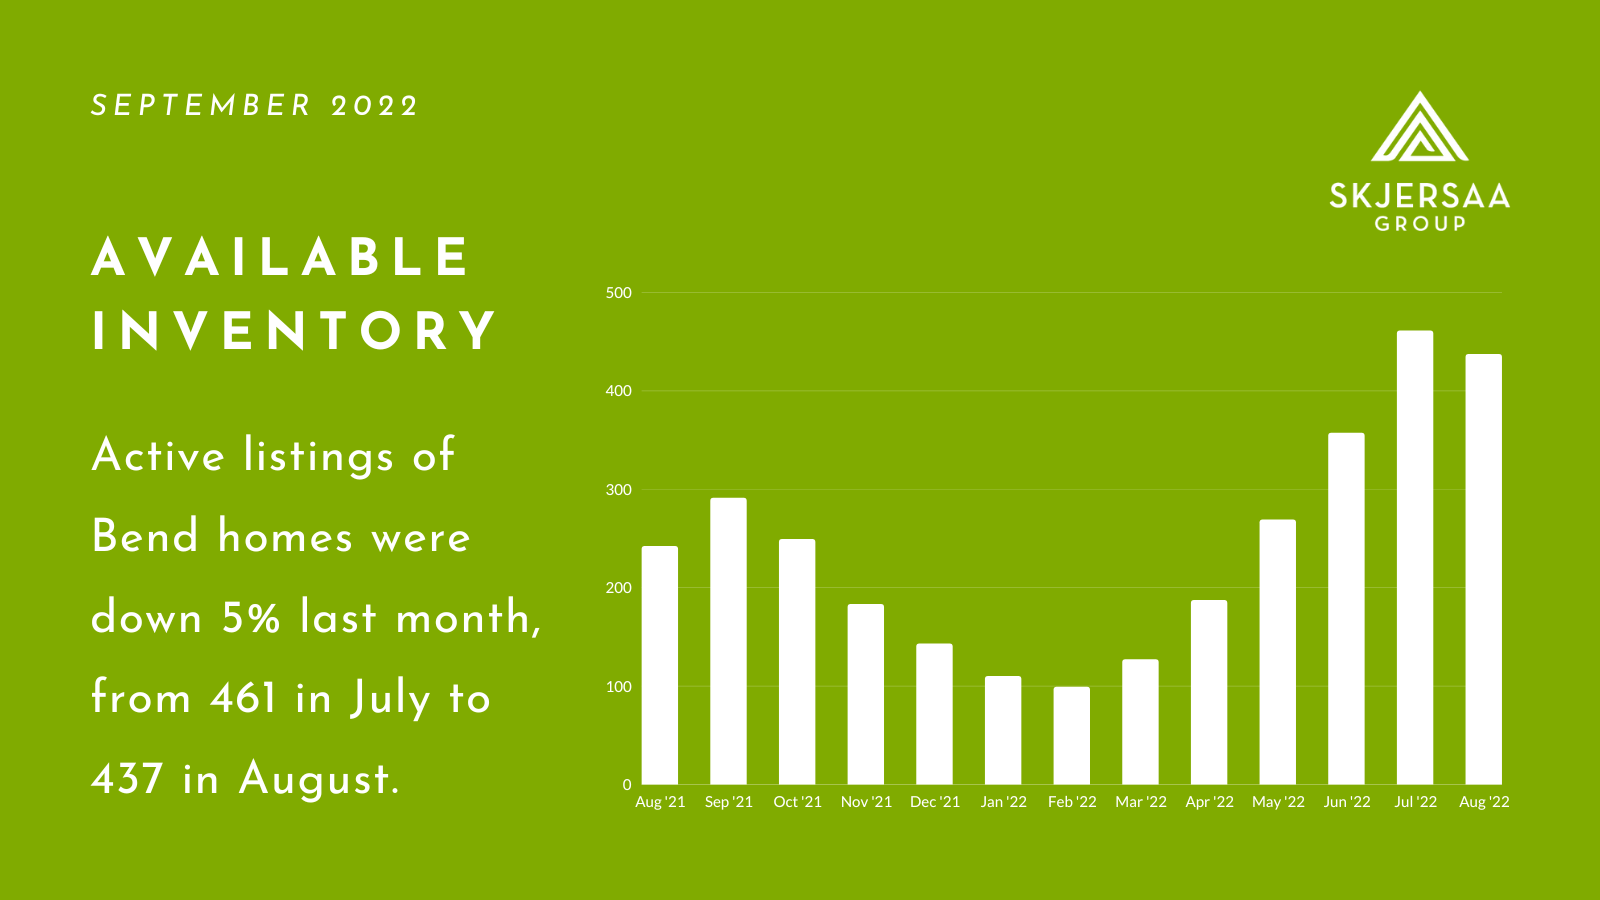
There were 437 active listings of Bend homes last month, down from 461 in July, but well over the 242 homes on the market in August 2021.
Last month, 188 Bend homes sold and 218 went pending, a bump of 5% and 18% respectively compared with July. Sales activity this August was slower than it was in August 2021, when there were 231 home sales and 263 homes pending. On average, it’s taking 25 days to sell a home in Bend. Last August, the average days on market was 14.
The median sales price is $717,000, a 7% decrease from July when it was $770,500, but a 13% increase year-over-year. Price reductions continue to be more common again, with an average of 61 price reductions each week over the last six weeks.
Have questions about the real estate market in Bend? We’re here to help you understand the complexity of current market trends, how interest rates are affecting buyer behavior, and the importance of a data-driven pricing strategy.
–Jason
Median Home Price
• The median price of a home in Bend is down 7%, from $770,500 in July to $717,000 in August.
• Annually, the median sales price is up 13%, from $636,282 in August 2021.
Active Listings and Months of Inventory
• Active listings of homes for sale in Bend are down 5%, from 461 in July to 437 last month.
• Compared to August 2021, active listings are up 81% (from 242 last year).
• The months of inventory is down 12%, from 2.6 months’ worth in July to 2.3 in August.
• Last August, there was 1.0 months’ worth of inventory.
New Listings
• There were 181 new listings in August, 22% fewer from July when there were 231.
• New listings in August were down 34% compared to a year ago when there were 275 Bend homes listed for sale.
Home Sold and Pending Sales
• Home sales in Bend were up 5% last month, from 179 in July to 188 in August.
• Year-over-year, the number of homes sold in Bend was down 19% last month compared to August 2021 when there were 231 home sales.
• Pending sales were up 18%, from 185 in July to 218 in August.
• Annually, pending sales are down 17%.
Days on Market and Price Reductions
• It took an average of 25 days for a Bend home to sell last month, a little longer than in July when it took an average of 21 days.
• Last August, homes in Bend were selling in an average of 14 days.
• Over the last six weeks, there were an average of 61 price reductions each week.
• Compared with the same six-week period in 2021, price reductions are up 53%.
