Active listings of homes for sale in Bend held steady and new listings were up 11% in October. There were 341 active listings last month, down just 1% from September’s 343 actives, and there were 144 new listings in October.
Unlike last fall, most of the real estate trends we track and report on were up—or down only moderately—from September to October. Last year, active listings in Bend were down 7% and new listings were down 30% between September and October.
Pending sales were down 3% last month, from 125 in September to 121 in October, and home sales were down 7%, from 137 to 127. Last year, pending sales dipped 23% month-to-month and sales were down 13% between September and October.
The median sales price of a home in Bend was $734,000 in October, a 2% decrease from $750,000 in September. Last October, the median sales price in Bend was $679,950 and represented a 6% decrease month-to-month. As for price reductions, there are an average of 39 each week based on data from the last six weeks, consistent with the six-week period prior.
It is taking longer to sell a home in Bend as we head into holiday time. In September, there was an average of 15 days on market. In October, that average jumped to 32 days.
Based on the October data, there is a 2.7 months’ worth of inventory in Bend, up from 2.5 months’ worth in September of this year and up from 2.4 months’ worth in October 2022. Generally, 6 months’ worth of inventory is considered balanced.
Have questions about the current market trends in Bend? We’re here to help you understand the many variables that affect available inventory and home prices.
—Jason
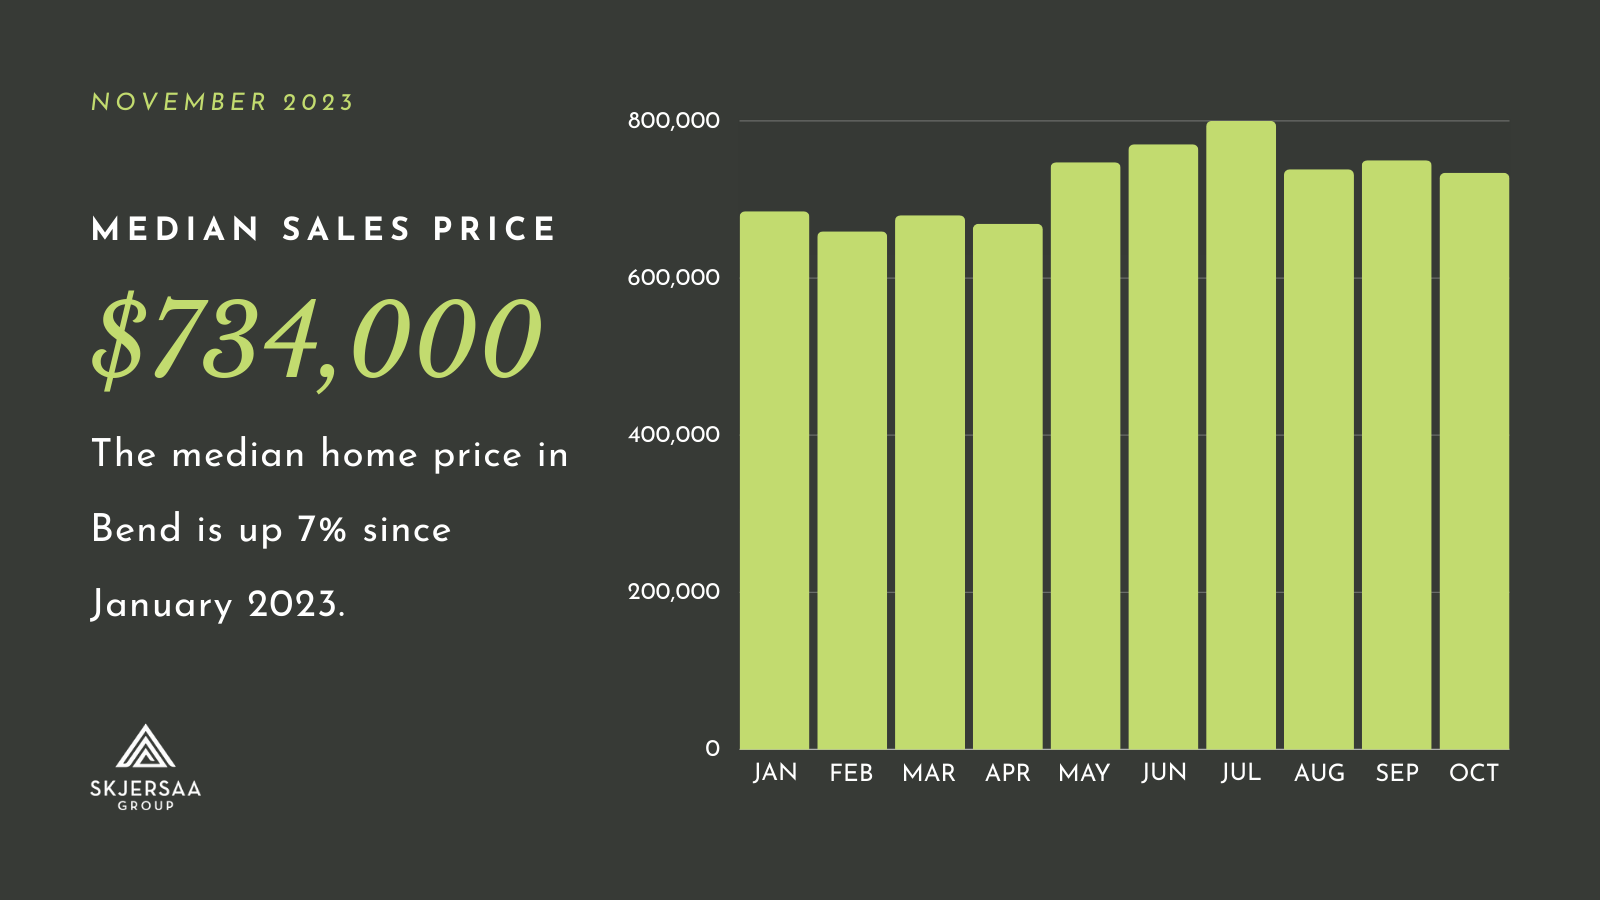
Median Sales Price
- The median home price in Bend was down 2% month-to-month, from $750,000 in September to $734,000 in October.
- Year-over-year, the median sales price is up 8% from $679,950 in October 2022.
New Listings
- New listings of Bend homes were up 11% in October, from 130 in September to 144 new listings last month.
- In October 2022, there were 130 new listings.
Home Sold and Pending Sales
- Home sales in Bend were down 7% last month, from 137 sales in September to 127 in October.
- Year-over-year, sales were down 20% compared with October 2022, when 159 Bend homes sold.
- There were 121 homes in pending status last month, down 3% from September.
- Pending sales were down 4% year-over-year compared with October 20222, when there were 126 Bend homes pending.
Active Listings and Months of Inventory
- Active listings of Bend homes were relatively flat month-to-month, with 341 actives in October and 343 in September.
- Active listings were down 12% last month compared with October 2022, when there were 389 Bend homes on the market.
- The months of inventory metric was up 8% last month, from 2.5 months’ worth in September to 2.7 months’ worth in October.
- Year-over-year, the months of inventory is up 13% in Bend.
Days on Market and Price Reductions
- The average time it takes to sell a home in Bend more than doubled last month, from 15 days in September to 32 in October.
- Last October, the average days on market for a Bend home was 38 days.
- There were an average of 39 price reductions each week over the last 6 weeks, 5% more than the prior 6-week period.
