Inventory at an all-time low and median home price at all-time high
Despite a rise in new listings last month compared with October 2019, buyer demand continues to keep available inventory of homes for sale in Bend at historic lows and drive the median home price up to an all-time high of $560,000. Our most recent data shows there was a 0.6-month supply of homes for sale in Bend last month compared with 5.1 months of inventory in October 2019. The median sales price of a Bend home was up 2% from September to October, and up 19% from October 2019 when it was $471,250.
We continue to see homes in every price range receive offers shortly after they are listed and transactions processed quickly as buyers are eager to get settled before the holidays. For buyers, the Bend real estate market is ultra competitive, and our team has been working hard to help active buyers move quickly when they find a home that fits their needs and fulfills their dreams. For sellers, pricing your home correctly and prepping it for virtual showings are still important components to an efficient sale. We are here to answer your questions about most current real estate data and dynamics.
Median Home Price
- The median home price rose again in October to an all-time high of $560,000.
- The median home price is up 2% from September and 19% from October 2019.
New Listings
- New listings dropped 19% from September to October, with 224 homes listed last month.
- However, there were 22% more new listings last month than a year ago when there 184 new listings in October 2019.
Home Sold and Pending Sales
- There were 13% fewer home sales in October than in September, but compared with October 2019, sales of Bend homes were up 20%.
- Last month, 250 homes in Bend were sold compared with 108 last October.
- Pending sales held steady month-to-month, with 268 homes pending in October (down only slightly from 272 in September).
- Year-to-year, pending sales were up 16% in last month compared to October 2019.
Active Listings, Available Inventory and Days On Market
- Active listings were down 18% last month, from 197 homes on the market in September to 162 homes in October.
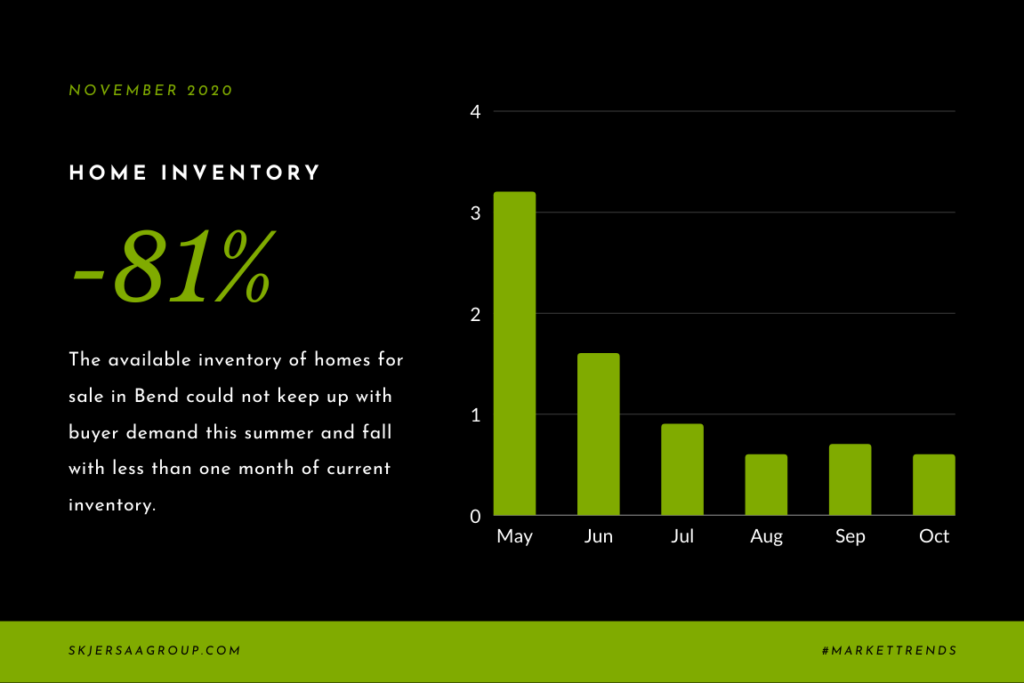
- Inventory continues to be at historic lows, with only a .6-month supply last month.
- Compared with October 2019, when there was 5.1 months worth, available inventory is down 88% year-over-year.
- Homes continued to go pending and sell at a brisk pace last month, with an average of 31 days on the market, a 48% decrease from October 2019.
Are you thinking about your real estate goals for 2021? Our team is ready to help you figure out what your home is worth, and how and when to bring it to the market.
– Jason
