February 2022 Market Trends for Bend Real Estate
The median sales price of a home in Bend hit a new high of $686,000 last month, a 2% increase over December when it was $675,000. Compared with January 2021, when it was $577,500, the median home price is up 19%.
Although the number of homes for sale in Bend is extremely limited compared with pre-pandemic years, there was 33% more available inventory this January compared with January 2021. The available inventory is currently 0.8-months’ worth. For comparison, the average monthly inventory was 3.9 months’ worth in 2019.
Some good news for buyers is that there was an increase of new listings in Bend last month and we anticipate that trend will continue as we head into spring. New listings were up from 127 in December to 147 in January, and the number of new listings was up year-over-year as well, with 7% more homes introduced to the market last month than in January 2021.
With the demand for homes in Bend still very high, there are important considerations for sellers. One is that, while it can be tempting to list your home with an extremely high price, valuation strategy is still very important. Not only does it ensure your home sells on your timeline, but it can also prevent selling it for less than you would have with the right price from the start. Another critical consideration we are emphasizing with our sellers is to have a solid plan for when your home does sell, whether you’re moving in-town or relocating to another city with equally high demand.
As you think about your real estate plans for 2022, please don’t hesitate to contact us with your questions. Our team has a well-rounded approach that is data-driven and also based on many years of experience in this unique real estate market. See more details on the current market trends below.
—Jason
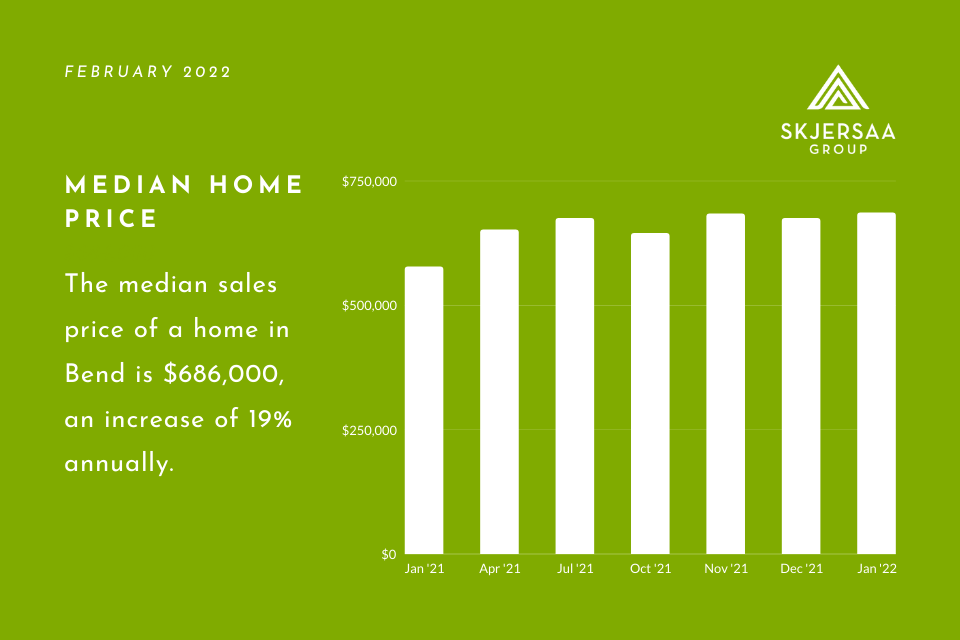
Median Home Price
- The median sales price of a home in Bend hit an all-time high of $686,000 in January.
- Month-to-month, the median home price is up 2%.
- The median home price is up 19% over last January, when it was $577,500.
New Listings
- There were 16% more new listings in January than in December, with 147 homes new to the market last month.
- Annually, new listings were up 20% compared with January 2021.
Pending Sales and Homes Sold
- Pending sales were up 5% month-to-month, with 177 homes going to pending status in January.
- Year-over-year, pending sales were up 10% (up from 161 in January 2021).
- Home sales were down 24% month-to-month, from 172 in December to 131 in January.
- Compared with January 2021, home sales were down 15% last month.
Active Listings and Available Inventory
- There were 23% fewer active listings in January, down from 143 in December to 110 last month.
- Year-over-year, active listings were up 20% in January.
- The available inventory of homes for sale in Bend stayed steady at 0.8-months’ worth in January.
- Compared with January 2021, the available inventory is up 33% from 0.6-months’ worth.
Days On Market and Price Reductions
- On average, it took 25 days to sell a home in Bend last month, down 17% from December’s 30 days on market.
- Compared with January 2021, the average days on market are up 33%.
- Price reductions remain rare with an average of only 5 price reductions weekly over the span of the last six weeks.
