The Bend real estate market was more active in February than in previous months, with home sales and pending sales each up 13% last month.
Pending sales were up again in February, from 123 in January to 164 homes last month. And many of January’s pending sales closed in February, boosting home sales in Bend from 84 in January to 112 last month.
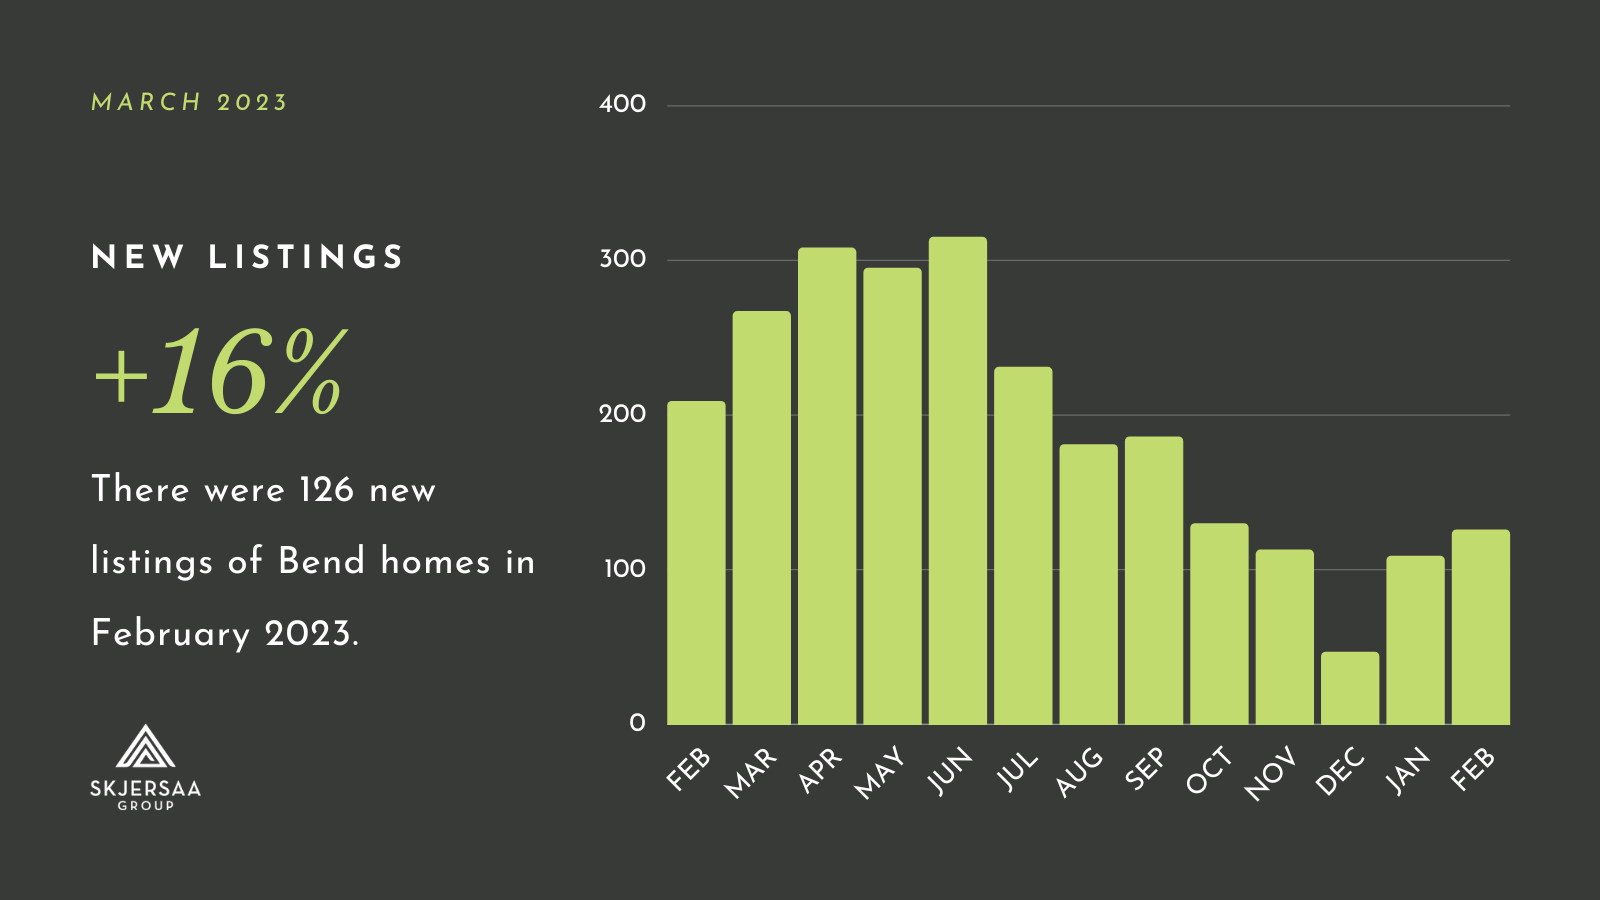
Although there were 16% more new listings last month compared with January, active listings were down 5% month-to-month. As of February 28, there were 209 homes on the market in Bend. The available inventory of Bend homes is up year-over-year—there were only 99 active listings in February 2022—but nowhere close to pre-pandemic inventory levels, which averaged between 400 and 500 homes per month.
It takes an average of 57 days to sell a Bend home right now, more than double the average days on market last February, but still shorter than the national average of 67 days.
The median home price was down 4% month-to-month, from $684,950 in January to $659,450 last month. Based on our weekly data, there have been an average of 19 reductions on asking prices each week since the beginning of the year.
With a 30-year fixed mortgage rate at 6.76%, having a data-driven price strategy that is mutually beneficial to sellers and buyers can help listings sell more quickly and ensure that transactions go as smoothly as possible.
If you haven’t yet seen it, our 2022 annual study on the Bend real estate market is a comprehensive report of market trends spanning the last decade. We use this weekly, monthly and annual research analysis to create real estate strategies for our clients, and we’re here to answer your questions about listing or buying a home in Central Oregon this year.
—Jason
Median Home Price
- The median sales price of a home in Bend is $659,450, down 4% from $684,950 in January.
- In February 2022, the median home price was $773,000.
New Listings
- New listings in Bend were up 16% in February, from 109 in January to 126 last month.
- There were 40% fewer listings last month compared to February 2022.
Home Sold and Pending Sales
- Home sales were up 13% last month in Bend, from 84 in January to 112 in February.
- Pending sales were also up 13% in February, from 123 in January to 164 last month.
- Year-over-year, sales activity is down; there were 213 pending sales and 132 home sales in February 2022.
Active Listings and Months of Inventory
- Active listings were down 5% in February, from 220 in January to 209 last month.
- However, compared to February 2022, active listings were up 111%.
- The months of inventory measurement is down 37%, from 3 months’ worth in January to 1.9 in February.
- There was only 0.8 months’ worth of inventory in February 2022.
Days on Market and Price Reductions
- On average, it’s taking 57 days to sell a home in Bend, just a few days longer than the average of 55 days in January, but quicker than the national average of 67 days.
- Last February, homes were selling in an average of 28 days.
- There has been an average of 19 price reductions each week since the beginning of the year.
- Our weekly data also shows that, after an average of 4 Bend homes back on the market each week in 2023, last week, 14 homes were back on the market.
