Although we continue to see an uptick of new listings, the supply still isn’t coming close to meeting the demand for a home in Bend, and the median home price is up a massive 40% year-over-year.
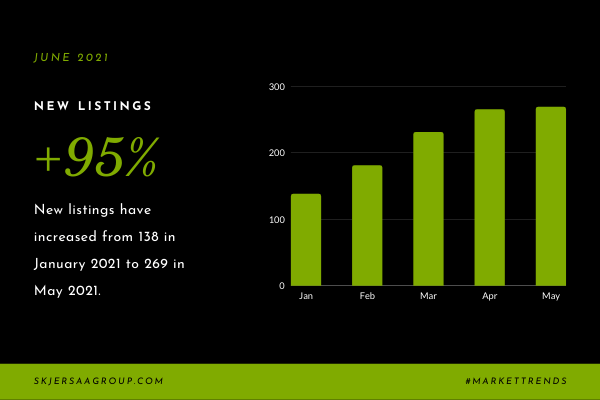
There were 269 homes listed in May, a 2% increase from April, and a 4% increase from May 2020. However, the number of new listings continues to be low compared to pre-pandemic years. For example, there were 408 homes listed in May 2019.
After an all-time high of $652,000 in April, the median home price in Bend went down 4% last month to $628,250. That’s well above last May’s median home price of $449,452, and a pure demonstration of how supply and demand affect home values.
If you are thinking about listing your Bend home, we encourage you to have a plan in place for where you will go and consult with a real estate group that has deep knowledge of the Central Oregon market. We love helping homeowners develop a strategy for selling their homes that keeps stress to a minimum. Please contact us for a virtual or in-person chat.
Median Home Price
- The median home price is down 4% from an all-time high of $652,000 to $628,250.
- In June of 2020, the median home price was $449,452.
- The median home price is up 40% year-to-year.
New Listings
- 269 homes were listed last month, a 2% increase over April.
- Year-to-year, new listings were up 4% in May.
Homes Sold and Pending Sales
- There were 227 home sales last month, a 6% decrease compared with the month before.
- Compared with May 2020, home sales were up 57% last month.
- Since June 1, there have been steady home sales at an average of 53 per week.
- 250 homes went pending last month, a 4% increase compare to April.
- Year-to-year, pending sales were down 12%.
- In the last three weeks, an average of 64 homes have gone pending each week.
Active Listings and Available Inventory
- Active listings were up 14% last month compared with April.
- There were 123 active listings of Bend homes in May, and our weekly data shows 134 active listings last week, and 127 the week prior.
- Year-to-year, active listings were down 73% last month compared with May 2020, when there were 462 homes for sale.
- Although the number of active listings is still much smaller than last year, we are seeing a weekly trend of increased listings, from 104 three weeks ago, to 134 last week.
- Available inventory is at 0.5 months’ worth, a decrease of 84% compared with May 2020.
Days on Market (DOM) and Price Reductions
- Homes are selling very quickly, with an average of 7 Days On Market.
- Last May, it took an average of 49 days to sell a home in Bend.
- Although price reductions continue to be rare, we are seeing a weekly trend over the last three weeks of a slight increase in reduced asking prices on select listings.
Please contact us with questions about the most current market trends for Bend real estate.
