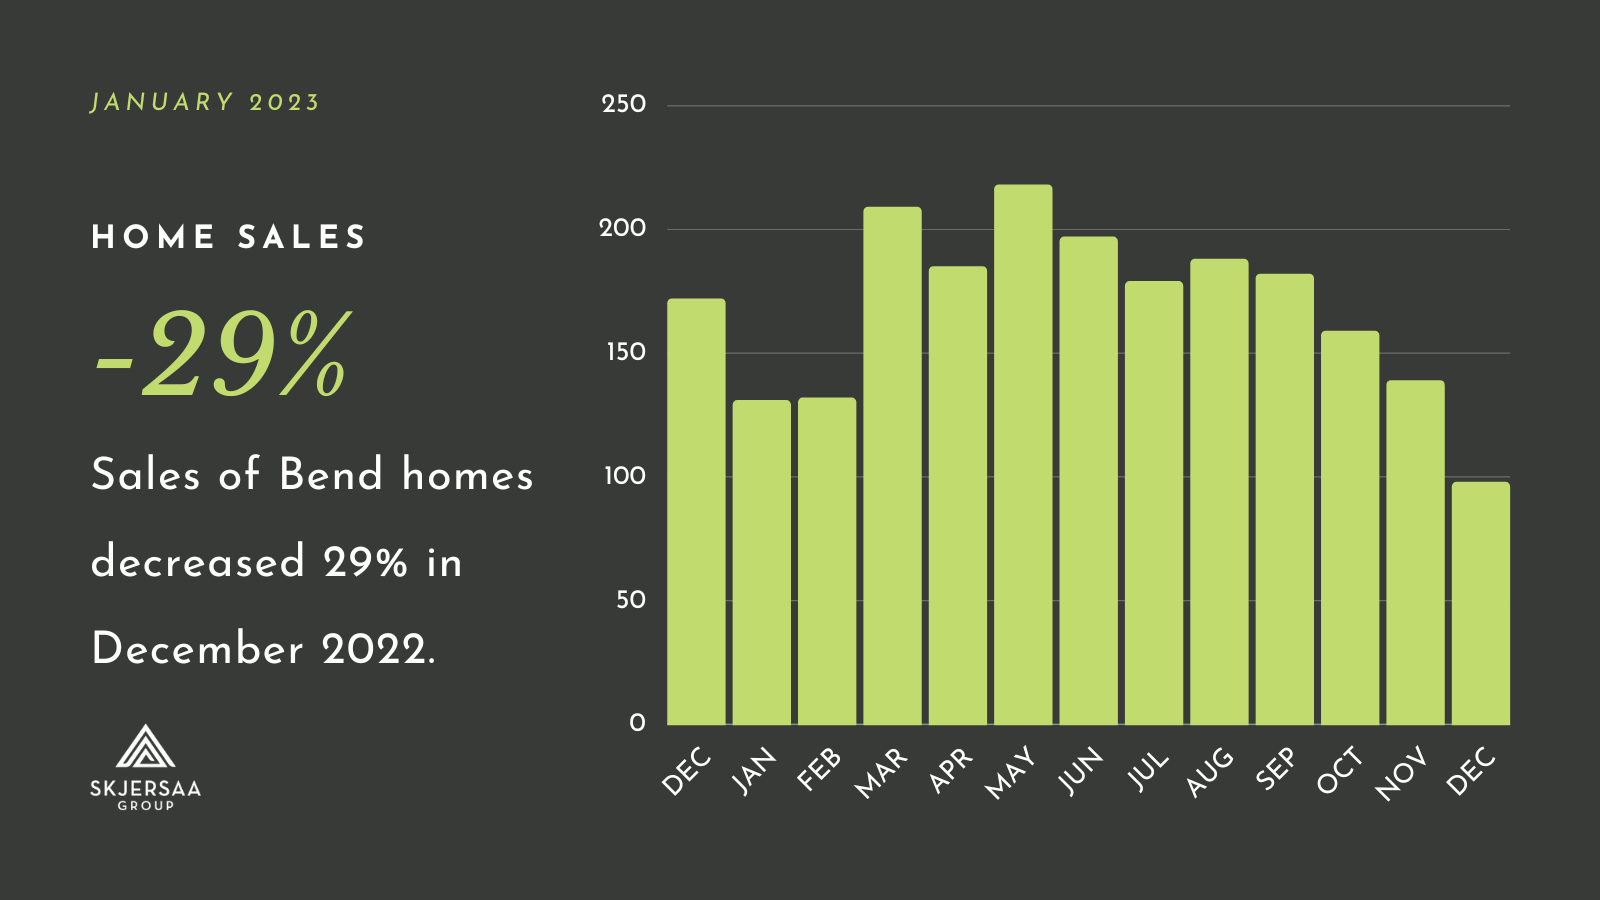
Although we typically see home sales slow during the holiday season, this year, the number of homes sold in Bend dropped 29% in December, from 139 sales in November to 98 last month. Pending sales were down 41% month-to-month, from 129 in November to 76 in December.
As a comparison, home sales in Bend slowed 14% between November and December of 2021, and pending sales were down 18% during the same month-to-month period.
There were 58% fewer new listings of Bend homes in December, from 113 in November to 47 last month. Active listings were down 22% month-to-month, but up 90% compared with December 2021.
The median sales price of a Bend home was $677,500 in December, down 3% from November when it was $695,900.
On average, it is taking longer to sell a home in Bend, from 30 days in December 2021 to 42 days last month. Based on our weekly data as of January 15, price reductions are less common than they were earlier in 2022. There has been an average of 18 price reductions each week over the last six weeks. In the six weeks prior, the average number of price reductions each week was 40.
Overall, we are seeing signs that the Bend real estate market is stabilizing after a few years of unprecedented activity during the pandemic. As inventory expands and sales activity slows, it’s important for sellers to have a data-driven strategy for listing their homes, and we’re here to help.
—Jason
Median Home Price
- The median price of a Bend home was $677,500 in December, down 3% from November when it was $695,900.
- Year-over-year, the median home price in Bend is up 13%, from $648,000 in 2021 to $729,900 in 2022.
Active Listings and Months of Inventory
- In December, active listings in Bend were down 22% month-to-month, from 347 in November to 271 last month.
- Active listings were up 90% last month compared with December 2021.
- There were 2.8 months of inventory in December, up 12% from November.
- Year-over-year, the months of inventory metric is up 250% when compared to 0.8 months in December 2021.
New Listings
- The number of new listings in Bend was down 58% last month, from 113 in November to 47 in December.
- In December 2021, there were 127 new listings.
- Based on our weekly data, new listings have increased so far in January 2023 (21 new listings the week of January 2, and 17 the week of January 9).
Home Sold and Pending Sales
- Home sales were down 29% in December, from 139 in November to 98 last month.
- Annually, sales of Bend homes were down 43% compared to December 2021.
- Pending sales were down 41% month-to-month, from 129 in November to 76 in December.
- Year-over-year, pending sales were down 55% last month compared to December 2021.
- So far, our weekly data shows an increase of home sales and pending sales over the first two weeks of January 2023.
Days on Market and Price Reductions
- It took an average of 42 days for a home to sell in December 2022, up from 37 days in November.
- In December 2021, it took an average of 30 days to sell a home in Bend.
- Over the last six weeks, there were an average of 18 price reductions each week.
- In the six weeks prior, the average number of price reductions each week was 40.
