Despite Increase of New Listings, Available Inventory of Homes for Sale Tightens
Although new and active listings were up last month, pending transactions and home sales were up also, and the available inventory of homes for sale in Bend was down 25% in March.
There were 267 new listings of Bend homes in March, up 28% from 99 new listings in February. The number of active listings was up 28% also, from 99 in February to 127 in March. Not surprisingly, buyers were ready for an influx of inventory, and 244 homes went to pending status and 209 homes in Bend sold last month.
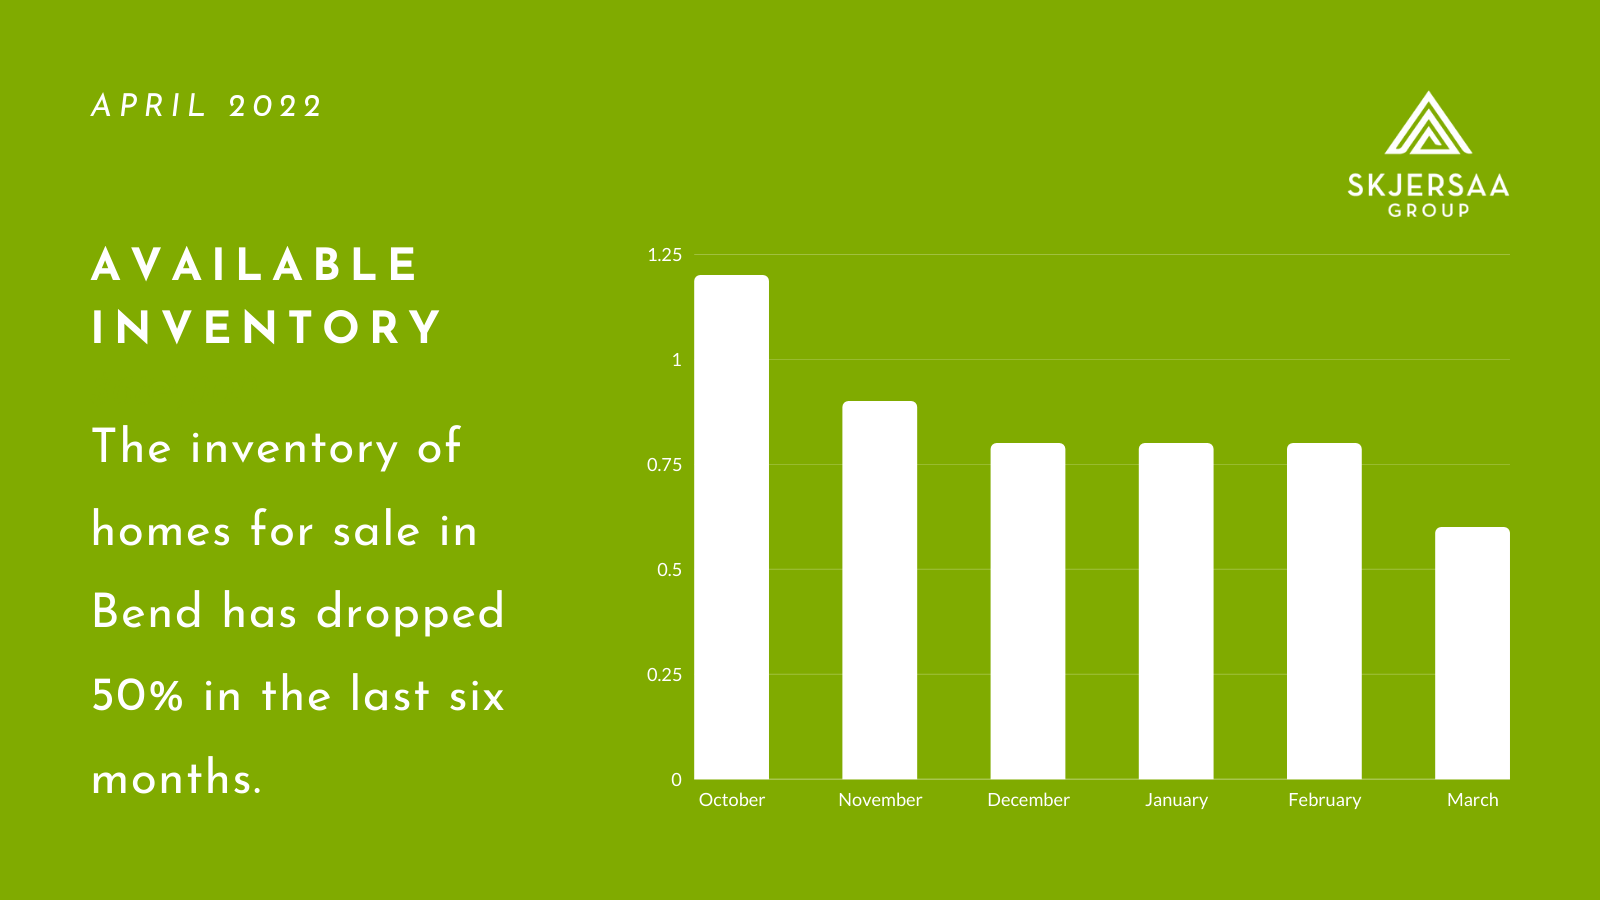
The available inventory of Bend homes went down from 0.8-months’ worth in February to 0.6-months’ worth in March. Two years ago, in March 2020, there was 2.0-months’ worth of home inventory in Bend. Homes sold an average of 26% more quickly last month than in February, with an average of 20 days on the market.
The median home price was down just slightly from $773,000 in February to $770,000 in March. That’s a 29% increase over March 2021, when the median sales price of a home in Bend was $597,500.
It’s not an easy time to buy or sell a home in Bend and having the support of a respected real estate team is more important than ever. We are here to help you create a real estate plan that works with your unique circumstances.
—Jason

Median Home Price
- The median home price in Bend is $770,000, down slightly from $773,000 last month.
- Year-over-year, the median price of a home in Bend is up 29% compared with March 2021 when it was $597,500.
Active Listings and Available Inventory
- The number of active listings rose 28% last month, from 99 in February to 127 in March.
- Annually, active listings were up 43% in March 2022 compared to March 2021.
- Active listings have continued to trend upward during the first couple of weeks in April, and there were 134 active listings last week.
- Available inventory was down 25% month-to-month, from 0.8 months’ worth in February to 0.6 months’ worth in March.
- There was 20% more available inventory last month than in March 2021 when it was 0.5 months’ worth.
New Listings
- New listings were up again last month, from 209 in February to 267 in March, an increase of 28%.
- Year-over-year, there were 16% more listings last month than in March 2021.
Pending Sales and Homes Sold
- Pending sales were up 15% last month, from 213 in February to 244 in March.
- There were 5% fewer pending sales last month compared to March of last year.
- Sales of homes in Bend jumped 58% last month, from 132 in February to 209 in March.
- Compared with March 2021, home sales were up 1
Days on Market and Price Reductions
- The average time it takes to sell a home in Bend is 20 days.
- The days on market shrank 26% last month compared to February, and 9% less than March 2021.
- Price reductions continue to be infrequent but have gone up from an average of 5 per week in January and February to an average of 10 per week over the last six weeks.

