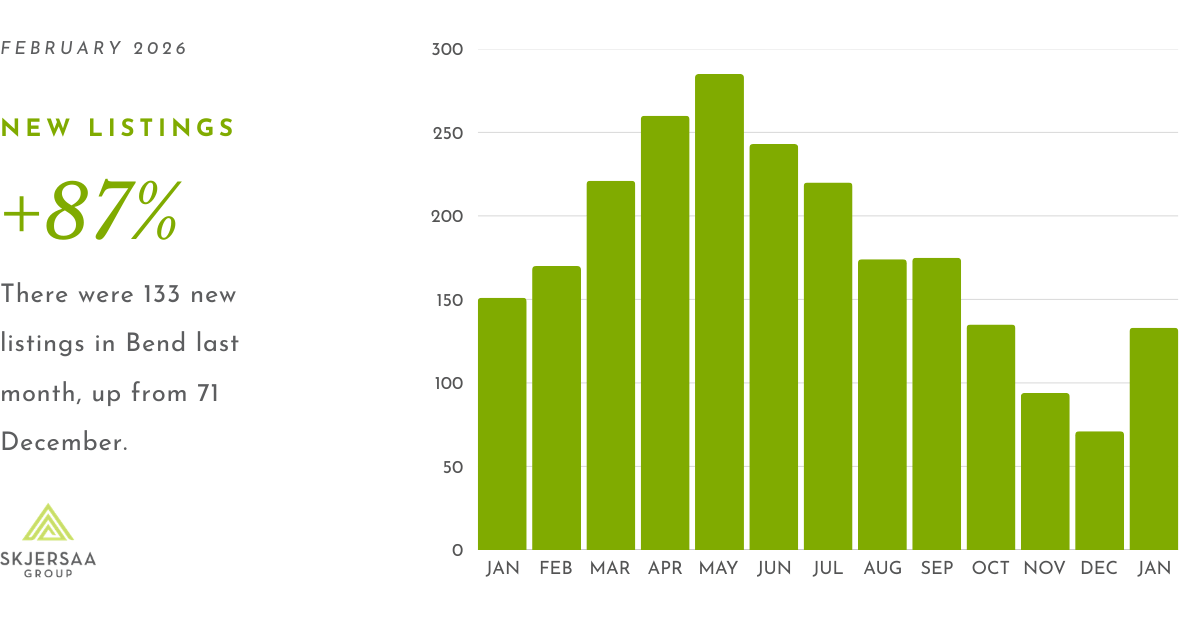
After a steady downward trend since September, new listings of homes in Bend rose 87% in January. There were 133 new listings last month, up from 71 in December.
The median sales price in Bend was $689,000 in January, within 1% of December’s price of $697,000. After concessions were calculated, only 1% of the homes sold last month were for over asking price. By comparison, that metric was 10% in December and 6% in January 2025.
Concessions that sellers provide to buyers are still a large factor in our market. In January, 85% of the homes sold in Bend were for under asking price after concessions were calculated. A year ago, that metric was 77%. And 42% of homes sold last month included some amount of concession compared to 48% in December and 41% in January 2025.
Home sales were down 30% in January month-to-month, from 128 sales in December to 90 last month. However, pending sales rose 29%, from 108 in December to 139 in January. Sales of new construction in Bend continued to hold steady in January, accounting for 29% of all home sales. All-cash transactions remain at pre-covid levels, and account for 26% of home sales.
The days on market extended from an average of 69 days in December to 99 in January, but are still below an average of 110 a year ago.
See more highlights from the January market trends below. And, if you haven’t yet seen our 2026 Annual Market Study, it’s a comprehensive report spanning 10 years to help you make data-driven decisions. As you think about your real estate plans for this year, we’re happy to answer your questions about the market trends for Bend and help you define a strategy that meets your goals. Please reach out!
—Jason
Median Sales Price
- The median sales price was $689,000 in January, within 1% of $697,000 in December.
- In January 2025, the median sales price was $738,000.
New Listings
- There were 133 new listings of Bend homes in January, an 87% increase from 71 listings in December.
- Year-over-year, new listings were down 12% when compared to January 2025, when there were 133 new listings.
Home Sold and Pending Sales
- Home sales decreased by 30% last month, from 128 in December to 90 in January.
- Pending sales were up 30% in January, from 108 in December to 139 last month.
- Year-over-year, home sales were down 22%, from 115 in January 2025 to 90 last month.
- Pending sales were up 5% year-over-year, from 133 in January 2025 to 90 last month.
Active Listings and Months of Inventory
- Active listings were down 14% in January, from 435 in December to 374 last month.
- In January 2025, there were 360 active listings.
- The months of inventory rose 24% last month, from 3.4 months’ worth in December to 4.2 in January.
- There was 3.1 months’ worth of inventory in January 2025.
Days on Market and Price Reductions
- It took an average of 99 days to sell a Bend home in January, longer than the average 69 days in December.
- In December 2024, it took an average of 110 days to sell a home in Bend.
- Over the last six weeks, an average of 32 homes each week were reduced in price.
