December Real Estate Market Trends for Bend, Oregon
As is typical for this time of year, new listings and sales activity have slowed somewhat according to our newest market trend data on Bend residential real estate. However, what is unique is that the median sales price of a home in Bend is at another all-time high. Typically, the median home price goes down or stays relatively steady as we head into the holiday season, but that isn’t the case this year.
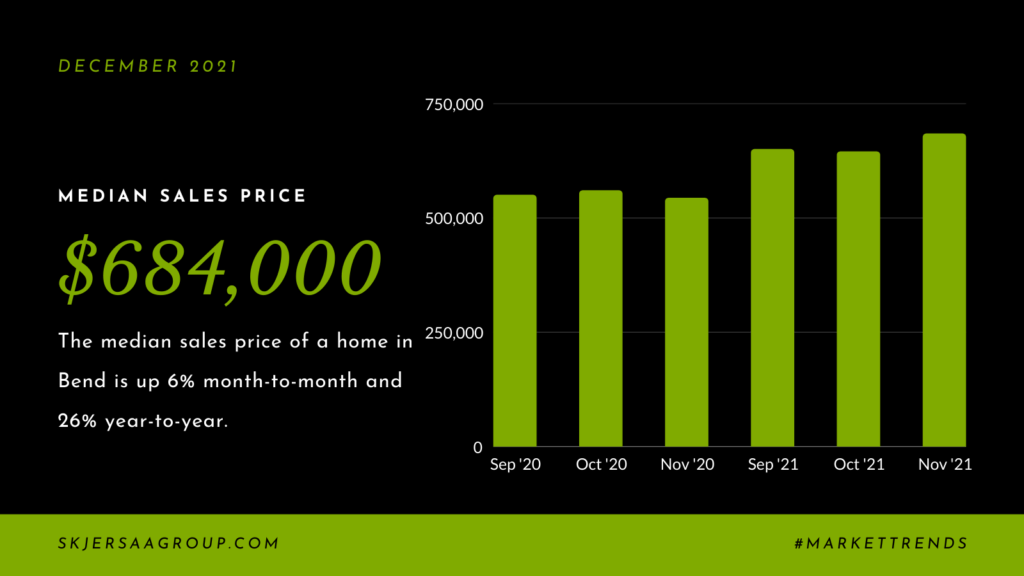
The median sales price of a Bend home rose 6% from October to November, from $645,000 to $684,000. Compared with November 2020, that’s a 26% increase in the median home price.
The number of active listings in Bend dropped 27% month-to-month, from 249 in October to 183 in November. However, there were 69% more active listings this November than November of 2020. Similarly, although the available inventory again dipped below one month’s worth and was down 25% from October to November, there is still 80% more available inventory of homes for sale in Bend than last November.
Putting your home on the market in the winter has its advantages, including less competition with other listings, and this year, that is especially true. We’re here to answer your questions about how to create a strategy for listing your home in Bend.

Median Home Price
- The median home price in Bend is up 6%, from $645,000 in October to an all-time high of $684,000 in November.
- Year-over-year, the median home price is up 26% compared with November 2020 when it was $543,500.
New Listings
- There were 9% fewer new listings in November (147) compared with October (162).
- Compared with November 2020, there were 34% more new listings last month.
Pending Sales and Homes Sold
- Pending sales were down 5% between October and November, from 204 to 215.
- Home sales were down 6% month-to-month, from 212 sales in October to 199 in November.
- Year-over-year, pending sales were up 17% last month compared to November 2020, and home sales were down 6%.
Active Listings and Available Inventory
- There were 27% fewer active listings in Bend last month, down from 249 in October to 183 in November.
- Compared with November 2020, the number of active listings in Bend was up 69%.
- The available inventory of homes for sale in Bend dipped just below one month’s worth in November (0.9 months).
- Available inventory was down 25% from October to November, but up 80% compared with November 2020.
Days On Market and Price Reductions
- Homes sold more quickly in November, with an average of 17 days on the market before an offer was accepted.
- In October, it took an average of 32 days to sell a home in Bend, and in November 2020, an average of 24 days.
- The number of price reductions has steadily declined over the last eight weeks, from 29 in mid-October to just 8 price reductions during the week of December 6.
—Jason

