Available Inventory of Homes for Sale in Bend Continues to Increase
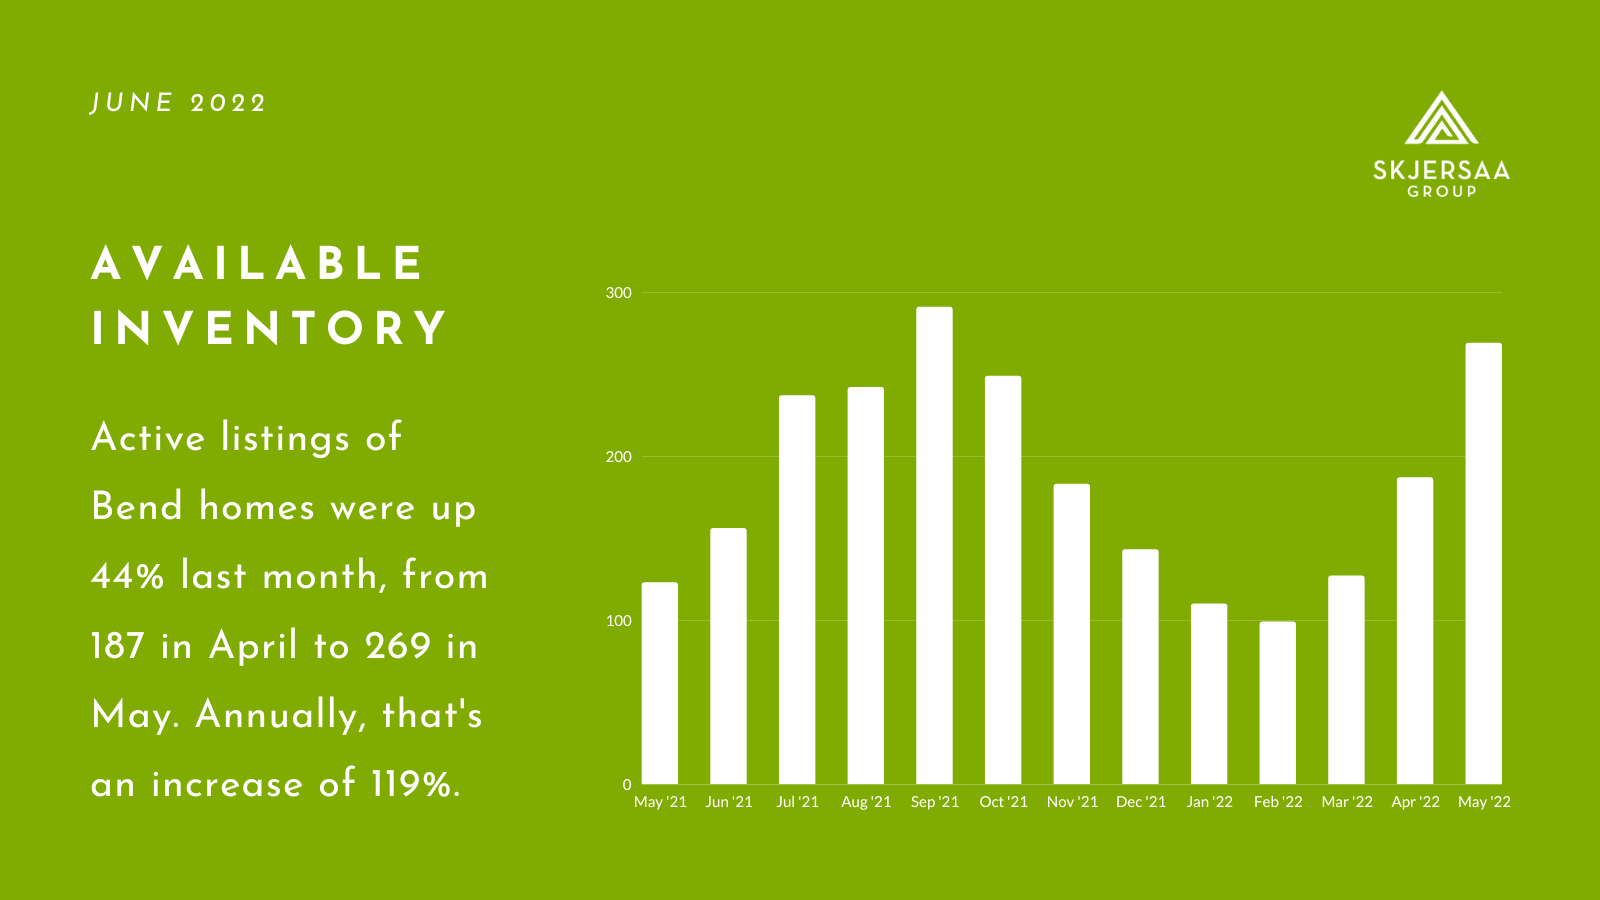
The available inventory of homes for sale in Bend continues to rise this spring based on our newest market trend data. The number of active listings was up 44% last month, from 187 in April to 269 in May. That’s a 119% increase year-over-year. The trend is continuing into June, with 312 active listings in Bend last week.
The median home price was down 4% month-to-month, from $769,900 in April to $740,000 in May, but up 18% annually.
Price reductions are becoming more common. The asking prices of 58 homes in Bend were reduced last week compared with an average of 44 each week in May (and only 21 each week in April).
Sales activity was up in May, with 245 pending sales (an 8% increase) and 218 home sales (an 18% increase) last month. There were 4% fewer new listings last month—269 in May compared to 187 in April—but still up compared to a year ago when 269 homes were listed in May 2021.
The length of time it’s taking to sell a home in Bend has risen dramatically over the last year. In May 2021, it took an average of only 7 days to sell a home. Last month, that average rose to 28 days.
As the real estate market in Bend adapts and shifts to accommodate ongoing demand from remote workers, a busy summer tourism season, and rising interest rates and inflation, having a well-planned strategy for listing your home ensures that it sells on your timeline with minimal disruption to your summer. Our team is here to help you!
—Jason
Median Sales Price
• The median home price in Bend is $740,000, down 4% from April when it was $769,900.
• Annually, the median sales price of a home in Bend is up 18% compared with May 2021 when it was $628,250.
Active Listings and Months of Inventory
• Active listings of homes in Bend were up 44% last month, from 187 in April to 269 in May.
• The number of active listings has continued to increase in June, with 312 active listings last week.
• Year-over-year, the available inventory is up 119%.
• The months of inventory increased 22% in May to 1.23 months’ worth.
• In May 2021, there was 0.5-months’ worth of inventory.
New Listings
• There were 4% fewer new listings last month, from 187 in April to 269 in May.
• Annually, new listings were up 10% in May.
Pending Sales and Homes Sold
• Home sales in Bend were up 18% last month, from 185 in April to 218 in May.
• Compared with May 2021, there were 4% fewer home sales last month.
• Pending sales were up 8%, from 226 in April to 245 in May.
• Year-over-year, pending sales were down 4%, from 227 in May 2021.
Days On Market and Price Reductions
• The average time it takes to sell a Bend home more than doubled last month, from 13 days in April to an average of 28 days in May.
• In May 2021, the average days on market was 7.
• Price reductions increased 48% in the last four weeks (49 price reductions) compared with the four weeks prior (33).
• Last week, the asking prices of 58 homes in Bend were lowered (June 6-12).
