Local real estate market activity is relatively consistent during different phases of pandemic
First of all, we hope your life is as peaceful and healthy as possible during these tumultuous times. With so much of our daily lives disrupted, many of our clients are surprised to hear that the local real estate market in Bend has weathered the COVID-19 pandemic in a relatively steady way.
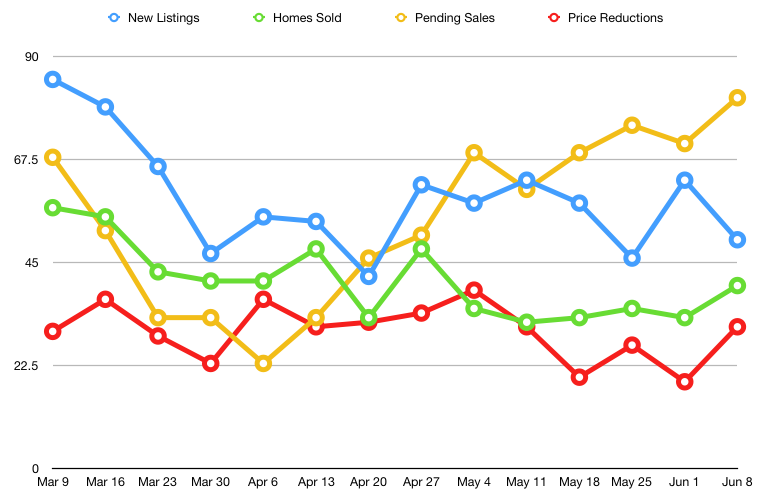
If you’ve been following our market trend blogs over the last few months, you know we’ve been tracking weekly data on the Bend real estate market and analyzing it side-by-side with the monthly data we normally provide. For this report, we’re comparing weekly statistics through June 14, 2020, with the monthly data for May 2020. Keep in mind that because the weekly data is more granular, it can vary more dramatically. It’s helpful to zoom out a little and consider trends over weeks, not week-to-week. We’ve been tracking weekly data for 14 weeks now, since the week of March 9, 2020.
The residential real estate market in Bend continues to show signs of consistent activity during the different phases of the pandemic. An influx of new listings in May helped boost what had been a limited inventory by 22% over April. There were 258 Bend homes listed in May, an increase of 34%, and the current inventory of homes on the market would take just over three months to sell at the current pace. Although sales were down month-to-month, pending sales increased dramatically, from 141 pending transactions in April to 285 in May. Transactions continue to process quickly during this time, with an average of 49 days on market for Bend homes.
Median Home Price
- The average selling price of a Bend home was $449,452 in May, down 3% from April when it was $461,000.
- The median home price in Bend is 4% lower than it was in May 2019.
New Listings
- There was a 34% increase of new listings in May, with 258 homes new to the market, up from 193 in April.
- New listings last month were down 37% compared with new listings in May of 2019.
- Based on the weekly data, new listings are down 41% over the last 14 weeks (since we began tracking weekly data the week of March 9).
Homes Sold and Pending Sales
- Home sales in Bend were down 15% from April to May, with 145 homes sold last month.
- That’s 38% fewer home sales in Bend than in May of 2019.
- Pending sales were up dramatically from April to May, with 285 homes in pending status last month (up from 141 in April 2020.)
- Compared with May 2019, pending sales held relatively steady, with a 3% increase year-over-year.
- The weekly data over the past l4 weeks shows a 30% decrease in Bend home sales since March 9, but a 19% increase in pending sales during the same time period.
Active Listings, Available Inventory and Days On Market
- Active listings were up 4% from April to May 2020, and up 16% from May of last year.
- Inventory is up month-to-month, from 2.61 months to 3.19 months of inventory.
- Inventory is up year-to-year as well, from 2.5 in May 2019 to 3.19 last month.
- As the pace of closing transactions continues to be brisk, the time it takes to sell a home is at an average of 49 days.
Price Reductions
- Reduced asking prices for Bend homes have increased only 3% over the last 14 weeks of weekly data (since March 9).

We hope you find this top-level information on the Bend real estate market interesting and helpful as you think about your real estate goals for 2020 and beyond. Because the Central Oregon Association of Realtors recently updated the reporting system for tracking local real estate activity, some metrics do not synch up apples-to-apples. We encourage you to contact anyone on our team for a deeper dive into the trends for the Bend real estate market. We’re happy to answer your email, chat on the phone or have a Zoom to answer your questions and help you plan your next real estate move.
