Happy New Year! If you follow our monthly market trend blog, you know we work hard to collect and analyze real-time data on Bend residential real estate month-to-month and even week-to-week.
When we present our market trend reports, we aim to provide context by comparing current data with historical metrics that help us identify statistical, long-term trends. But the last 21 months have presented us with metrics that have been unprecedented to say the least, and certainly unexpected.
We’re working on our bigger-picture annual market trend report and will be presenting that soon. In the meantime, here’s what we know about the Bend real estate market using data from December 2021 and our weekly data through January 9.
Median Home Price
- At $675,000, the median sales price of a home in Bend is down 1% from November when it was $684,000.
- The median home price is up 30% compared with December 2020 when it was $519,388.
- Over the last two years, the median price of a Bend home is up 54% compared with December 2019 when it was $439,995.
New Listings
- There were 127 new listings in December, 13% fewer than November when there were 147.
- Year-over-year, new listings were down 14%; there were 148 new listings in December 2020.
- In December 2020, new listings jumped 35% month-to-month, but that’s not a typical trend.
- In December 2019, new listings were down 43%, from 136 in November 2019 to 78.
Pending Sales and Homes Sold
- There were 168 Bend homes that went pending in December, down 18% from November when there were 204 pending sales.
- Pending sales were up 14% year-over-year in December.
- Home sales were down 14% last month compared with November.
- There were 172 homes sold in December and 199 in November.
- Annually, home sales were down 20% last month compared with December 2020 when 215 homes sold.
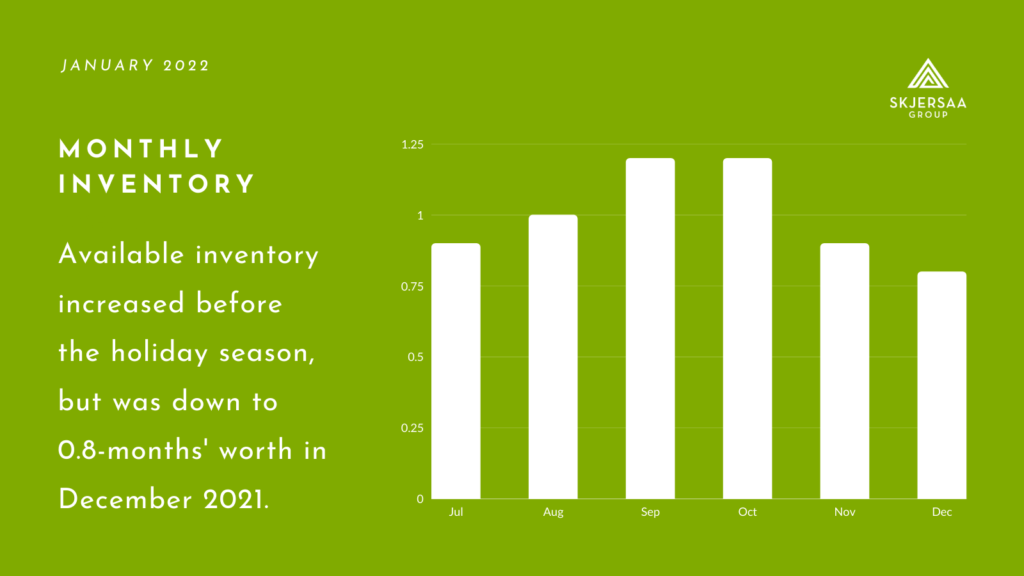
Active Listings and Available Inventory
- Active listings were down 22% from November to December, but up 31% compared with December 2020.
- There were 143 active listings last month, down from 183 in November.
- In December 2020, there were 109 active listings.
- The available inventory was down 10% last month, with 0.83-months’ worth of listings.
- Annually, the December inventory was up 66%; in December 2020, there was 0.5-months’ worth of listings.
- Compared with December 2019, available inventory is down 79%; there was 3.9-months’ worth of inventory two years ago.
Days On Market and Price Reductions
- As is typical over the holiday season, it took longer to sell a Bend home in December, with an average of 30 days on the market.
- The Days On Market was up 76% from November, and up 43% from December 2020 when it was an average of 21 days.
- In December 2019, it took an average of 61 days to sell a home in Bend.
- The number of price reductions remains low, with an average of 7 homes in Bend reduced each week over the last six weeks.
As you think about your real estate goals for the coming year, we are here to answer your questions about how the data we have on the Bend market can inform your strategy. We hope to connect with you soon.
—Jason
