We love being asked about the weekly and monthly data we curate and analyze to help our clients understand the Bend real estate market, and one of the most frequent questions we’ve been getting recently center on whether this is the “top” of the market.
Because real estate markets—especially those like the one in Bend—are so dynamic, we look for long-term trends in our data that can help us answer big questions. As we move into a natural, seasonal pattern of fewer new listings and reduced sales activity, it’s interesting to see the ways that 2021 continues to be its own unique year compared with years prior to 2020.
After having an incredibly limited number of homes for sale earlier this year, we’re seeing a five-month trend of increased inventory in Bend. And, even as the inventory increases, the median home price is at $650,000, a 2% increase from $636,282 in August, and an 18% increase from September 2020 when the median home price was $549,900.
Fortunately for buyers, the inventory increased 19% between August and September, and the number of active listings in Bend increased 20% month-to-month. The number of homes for sale in Bend was up 48% last month compared with September 2020.
It will be interesting to see how the Bend real estate market will be—and might not be—affected by the seasonal trends we typically experienced over the holidays in pre-pandemic years. In the meantime, we are ready to help sellers strategically price and list their homes in this adaptive market and assist buyers in making relevant, timely offers. Please contact us to get started.
Median Sales Price
- The median sales price in September was $650,000, up 2% from $636,282 in August.
- Year-over-year, the median sales price is up 18% compared with September 2020, when it was $549,900.
New Listings
- The number of new listings was down 14% in September, from 275 in August to 237 in September.
- Compared with September 2020, new listings were down 15%.
Pending Sales and Homes Sold
- Pending sales were down 11% last month, from 263 in August to 233 in September.
- Year-over-year, pending sales were down 14% last month compared to September 2020.
- Home sales stayed steady last month, with 235 homes sold in September compared with 231 in August.
- Compared with September 2020, home sales were down 18% last month.
- Combined sales activity of homes going pending and sold was down 5% from August to September.
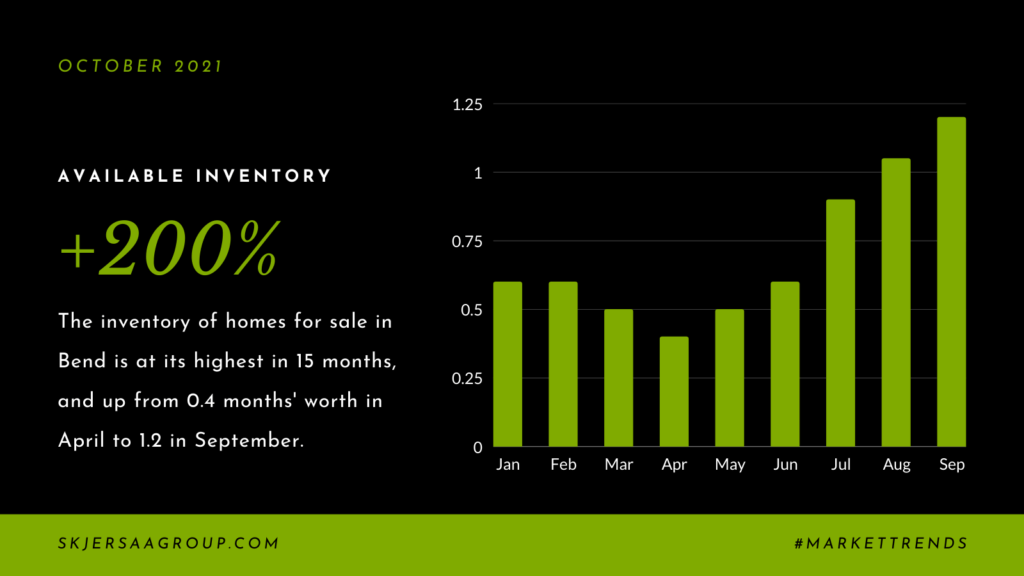
Active Listings and Available Inventory
- Active Listings were up 20% in September, with 291 Bend homes on the market, compared with 242 in August.
- In September 2020, there were 197 active listings—48% less than this September.
- Available inventory Bend homes for sale is up 19% month-to-month, and 71% year-over-year.
- There was 1.2 months’ worth of available inventory in September.
Days on Market and Price Reductions
- The average time it takes to sell a home was 17 days in September, a little longer than in August when it was 14 days.
- In September 2020, it took an average of 35 days for a home in Bend to sell.
- On average, there are 36 price reductions each week over the last two months.
We look forward to hearing from you soon!
—Jason
