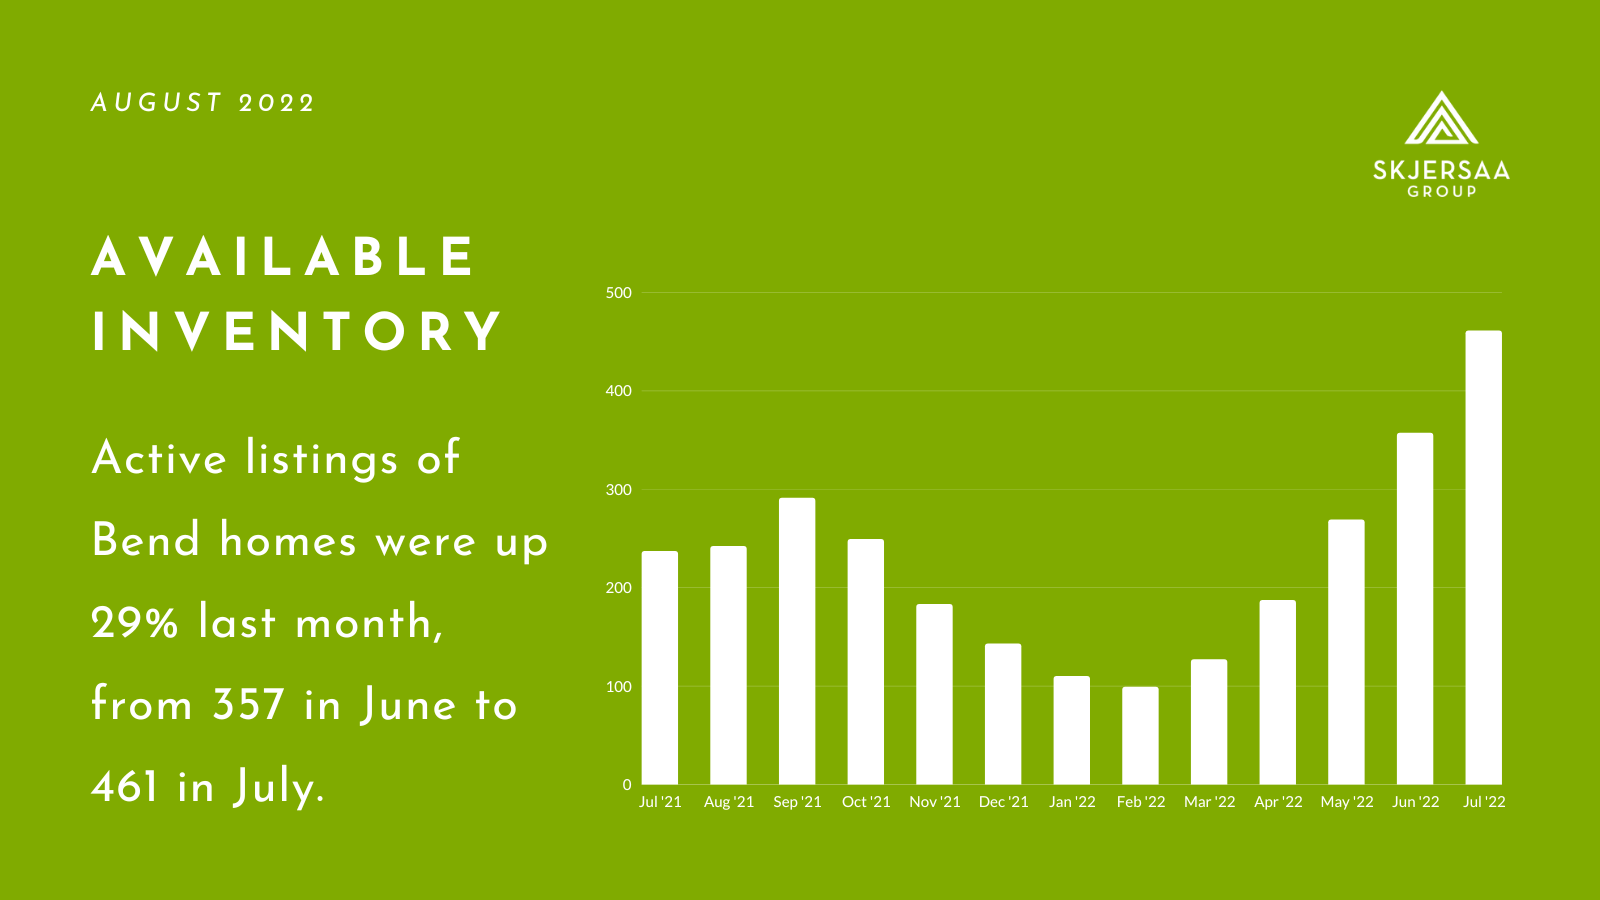
The available inventory of homes for sale in Bend continued to trend upward in July with 461 active listings in the local real estate market. That was a 29% increase from June, when there were 375 active listings, a 95% increase annually, and the highest available inventory since the spring of 2020.
Home sales were down 9% last month in Bend, from 197 in June to 179 in July. Annually, sales were down 28%. Pending sales were down year-over-year as well, from 243 last July to 185 last month, but up 2% from June 2022.
It’s taking longer to sell a Bend home than it did earlier this year—and last year. Last month, the average days on market was 21, up 75% from June when it was 12 days, and up 163% from last July when it took an average of 8 days to sell a home.
Price reductions are becoming more common again, with a weekly average of 72 homes on the Bend market with asking prices that have been lowered (measured over the last six weeks).
The median sales price of a home in Bend is $770,500, up 7% from June, but consistent with median prices earlier this year, including the all-time high of $773,000 in February 2022.
It’s not easy to price a home in the Bend market, but our team works hard to track and analyze monthly—and even weekly—market trends to help us provide data-driven strategies to our clients. If you’re thinking about listing your Central Oregon home, we’re here to answer your questions about timing, pricing strategy and meeting your real estate goals.
Median Home Price
- The median price of a home in Bend is up 7% month-to-month, from $720,000 in June to $770,500 in July.
- Year-over-year, the median home price is up 14% from $675,000 last July.
Active Listings and Months of Inventory
- There were 29% more active listings in Bend last month, from 357 in June to 461 in July.
- Annually, there were 95% more active listings compared to last July when there were 237.
- The months of inventory was up 44% last month, from 1.8 months to 2.6.
- Last July, there was 0.9-months’ worth of inventory in Bend.
New Listings
- There were 231 new listings in Bend last month, down 27% from June where there were 315.
- New listings were down 24% annually, from 305 last July.
Pending Sales and Homes Sold
- Pending sales were up 2% from June to July, from 181 to 185.
- Annually, pending sales in Bend were down 24%.
- Sales of homes in Bend were down 9% last month, from 197 in June to 179 in July.
- In July 2021, there were 243 pending sales and 250 Bend homes sold.
Days on Market and Price Reductions
- Homes in Bend are taking more time to sell, from 12 days in June to 21 days in July.
- Last July, Bend homes were selling in an average of 8 days.
- Over the last six weeks, there was an average of 72 price reductions weekly.
